
Trade Zoom for Asset Managers
Abel Noser Solutions’ Trade Zoom is the industry leading post-trade tool that allows you to measure trading performance. It provides information on your trading strategies along with time-specific data for each step of the trading process. With over 1,000 possible measures built into the tool, you can go right to the analytics that interest you the most.
Trade Zoom also offers the transparency you need to understand and manage trading costs, allowing you to evaluate historical trading performance over a specified period of time. You can compare costs, evaluate strategies and identify improvement opportunities.
GLOBAL ASSET COVERAGE
Equities
Preferred Stock
Foreign Currency
Treasuries
Agencies
Corporate
Futures
Options
Trade Zoom Features
- One of the fastest TCA platforms in the industry
- Intuitive interface with powerful versatility, allowing you to focus on your trading
- Custom benchmarking against the largest universe of TCA data, at no extra cost
- API connectivity
- Drill-thru to underlying data points like timestamps, market data and cost results
- Critical trade data (including market data points and notes) recorded in a long-term depository allowing compliance and regulatory review
- Volumes metrics, strike prices, quotes, spread costs and much more
- Reports, aggregated for internal and external use, are available on-demand and customized, can be scheduled, or delivered by email
- Competitive and customized pricing options
Confidential and Secure
Trade Zoom data is kept confidential and secure. We can also set tiered access levels for users within your own organization. Hundreds of clients entrust their trade data to Abel Noser Solutions. You benefit by sharing in the scope of our knowledge and experience, while remaining anonymous at all times. Learn more >
Trade Zoom for Equities
- Over 350 built-in measures, with specific data for each step of the trading process
- Manager Styles feature provides empirical analytics that enables the visualization of a manager’s timing relative to price movement
- View costs incurred at every level of the trade cycle at high and granular level
- Largest peer universe with trading data collected from over 750 investment managers representing more than $15 trillion in equities trading
- Additional equity broker ranking report available via TT® Broker Scorecard, providing rankings of global and regional brokers by liquidity and execution quality.
Trade Zoom for Fixed Income
Many people in the fixed income world caution others about applying equity-based TCA models to fixed income trading. And there’s a lot of truth in that. However, it’s equally important to recognize that there are some very important commonalities. And much of the equity TCA experience is, in fact, very relevant to fixed income trading. For example, consider the following common ground between equities and fixed income oversight:
- The need to consider the intent of the PM
- Decisions about whether it is a high touch or low touch trade
- Importance of monitoring execution quality
- Need for a strong governance regime to supplement quantitative reports
In short, best execution is a process and TCA is a component of that process. More than any other analytics company, Abel Noser has the experience, ability and next-gen technology to provide the measurement you need to preserve alpha while maintaining a robust compliance program. Here are some characteristics of our fixed income TCA solution:
- Coverage includes US Treasuries, global corporate and sovereign bonds, US mortgage backed securities, European mortgage and ABS, consumer ABS, municipal bonds, bank loans and credit default swaps
- Costs are calculated in multiple units including price, aggregate dollar amount, and BPS of market value traded
- Trading benchmarks include last mid-price, bid or offer prior to the trade, or prior day close
- Over 190 built-in measures
Trade Zoom for FX
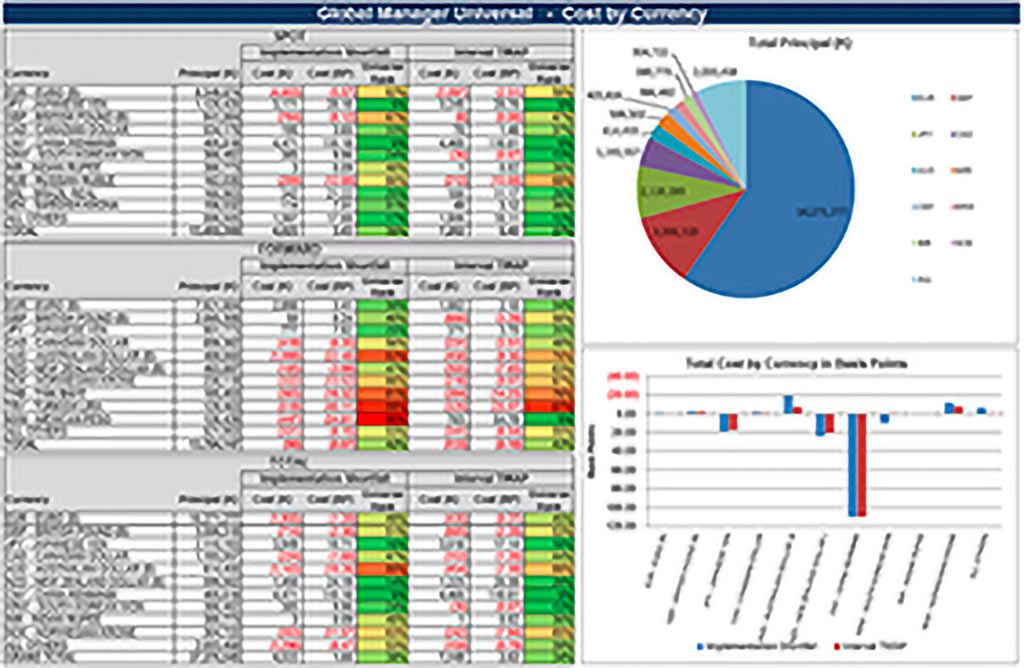
Trade Zoom can help you lower currency trading costs while satisfying regulatory, client and governance requirements. FX features include the ability to:
- Calculate absolute and relative costs by numerous critical measures (i.e. spots, forwards, swaps)
- Show impact when trading with “standing order instructions” versus “negotiated transactions”
- Quantify the true costs of your custodial relationships
- Show worst and best cost trades; strike price and average price metrics
- Offer assessments that are un-conflicted compared to reports produced by interested counter-parties
- Over 30 built-in measures
Trade Zoom for Futures
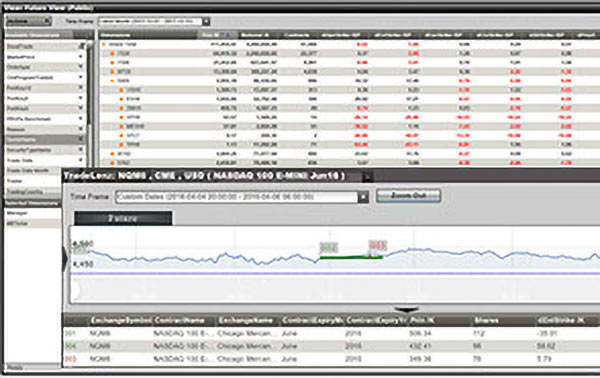
By utilizing various measures built into our easy-to-use interface, you can review algo participation during market variances, compare trading across different markets and venues, quantify execution quality and measure performance. In short, we offer the tools you need to compete in today’s electronic trading environment. Trade-Zoom’s Futures TCA features include the ability to:
- Quantify the implementation costs of futures hedging strategies
- Utilize broker performance metrics and execution-quality exception checks
- Assess efficacy and costs of your algorithm strategies
- Minimize reversion and implementation shortfall
- Compare your absolute trading costs to relative peer universe costs
- Track market liquidity to assess trade impact
- Identify alpha opportunities in you your timing work flow
- Over 30 built-in measures
Trade Zoom for Options

The post-trade historical analysis in our industry-leading options TCA tool clarifies your trading costs leading to actionable insight. The easy-to-use interface enables you to compare trading across different markets and venues, quantify execution quality
- Quantify the transaction costs of options hedging and speculative strategies
- Measure calls and puts, spreads, straddles, strangles, buy-writes, and more
- Evaluate broker performance metrics and execution quality; identify outliers
- Compare your individual trading costs to peer benchmarks
- Track market liquidity to assess trade impact
- Directly measure against ticks and quotes from all global exchanges and OPRA liquidity
- Monitor high-cost outliers or trades outside the quoted spread
- Build custom data reports
- Over 190 built-in measures
Trade Zoom for Alpha Profiling
Our Manager Styles feature is an alpha profiler that breaks out data by portfolio manager. You can see the specific approaches that each portfolio manager took throughout a trade life cycle, illuminating the rationale for buying a stock, price confirmation process, venue choices and numerous other trade elements. Behind the scenes, Trade Zoom employs robust technology that enables you to slice and dice your data in almost any way imaginable. Armed with this information, you can make informed, alpha-producing execution decisions.
Common questions Trade Zoom will enable you to easily answer include:
- How much did the price move during trading?
- How did a manager perform versus the market?
- How was trading performance based on price-volume considerations?
- How did a portfolio manager’s style affect trading costs?
- What venue routing decisions were made and why?
SET UP A FREE TRIAL
We can set up a FREE TRIAL using your own EMS/OMS data so you can experience first-hand the clear value of our data extracts.